
Authors: Meng Chen, Research Associate, HCCI, and Aaron Yao, Research Director, HCCI
Introduction
Medical Expenditure Panel Survey (MEPS) data show that about 14% of the U.S. civilian, noninstitutionalized population had no personal healthcare expenditures in 2019. At the same time, only 5% of the population accounted for nearly half of healthcare spending (48.8%, Figure 1). This spending includes all sources of payments for medical care, including private insurance payments, Medicare, Medicaid, out-of-pocket expenses, and other sources.
Concentration of healthcare expenditures
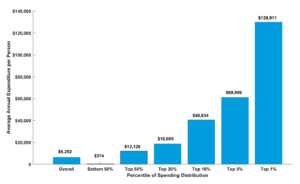
In 2019, the top 1% of persons ranked by their healthcare expenditures accounted for 20.8% of total healthcare expenditures (Figure 1), with an annual mean expenditure of $129,911 (Figure 2). The group within the top 1% is defined as persons who spent $78,080 or more during the year (Table 2). The top 5% of the population accounted for 48.8% of total expenditures (Figure 1), with an annual mean expenditure of $60,989. The bottom 50 accounted for only 3% of total healthcare expenditures. Every person in this group spent less than $1,313 during the year (Table 2), with an average annual expenditure of $374 (Figure 2).
Figure 1. Concentration curve of healthcare expenditures,
U.S. civilian, noninstitutionalized population, 2019

Table 1. Data for concentration curve of healthcare expenditures,
U.S. civilian, noninstitutionalized population, 2019
[table id=1 /]
Table 2. Percentile of population ranked by spending and amount spent during 2019
[table id=2 /]
Figure 2. Mean total expenditures per person by percentile of spending, 2019
Health expenditures in older adults
Older adults made up 16.3% of all the U.S. civilian, noninstitutionalized population, but their expenditures accounted for 33.4% of total healthcare spending (Figure 3).
In 2019, the top 1% of older persons ranked by their healthcare expenditures accounted for 12% of total healthcare expenditures (Figure 3), with an annual mean expenditure of $157,215. The group within the top 1% is defined as persons who spent $105,463 or more during the year (Table 4). The top 5% of the population accounted for 33.5% of total expenditures (Figure 3), with an annual mean expenditure of $85,940. The bottom 50% accounted for only 8.6% of total healthcare expenditures (Figure 3). Every person in this group spent less than $5,602 during the year (Table 4), with an average annual expenditure of $2,216.
Figure 3. Concentration curve of healthcare expenditures, older U.S. population, 2019

Table 3. Data for concentration curve of healthcare expenditures, older U.S. population, 2019
[table id=3 /]
Table 4. Percentile of older population ranked by spending and amount spent during 2019
[table id=4 /]
Source: Agency for Healthcare Research and Quality, Medical Expenditure Panel Survey, Household Component, 2019